
A goal up at the break, and the bet looks safe. Or does it? For live bettors and anyone backing a half-time/full-time result, the question is simple: how often does a half-time lead hold, and how often does the trailing team come back? We checked the half-time and full-time scores of 161,983 matches from 22 European leagues since 2005/06, and added a section on draws with the bookmakers’ odds.
The short answer: the team leading at half-time won 74.2% of matches, drew 17.8% and lost only 8.0%. A one-goal half-time lead is far less safe than a two-goal one. Draws are priced almost exactly by the market, with one league as a stand-out.
Key findings
- Home teams leading at half-time won 78.3%, away teams leading at half-time 68.4%.
- With a one-goal half-time lead the leader won 67.9%; with two goals 90.2%; with three or more 98.1%.
- Strong favourites (70% or more before kickoff) who were a goal down at half-time still won 39.9% and drew 29.4%.
- 31% of matches were 0-0 at half-time. Only 16.4% of those ended with three or more goals.
- Backing every draw lost 8.6% per bet at average odds. In Serie B, draws have been profitable at average odds since 2016/17 (+3.6%).
Contents
The data and the method
We used the free historical results and odds from football-data.co.uk, which include the half-time score of every match. The analysis covers 161,983 finished matches from 22 European leagues, 2005/06 to 2025/26.
- Half-time lead means one team is ahead at the break. “Holds” means the same team wins the match.
- Pre-match win chance is the win probability from the average odds before kickoff, with the bookmaker margin removed.
- Draw returns are the average profit or loss of a one-unit bet on the draw at the average odds, the best available price and, from 2012/13, Pinnacle’s closing odds.
- There are no half-time/full-time odds or live odds in the data. This article shows how often things happen. Whether a live price is good value depends on the odds you get.
Half-time/full-time: all nine outcomes
A half-time/full-time bet has nine possible outcomes. Here is how often each one happened. The most common was a home lead at half-time that became a home win (26.4%). The rarest were full reversals: a home lead that turned into an away win (2.0%) or the other way round (2.6%).
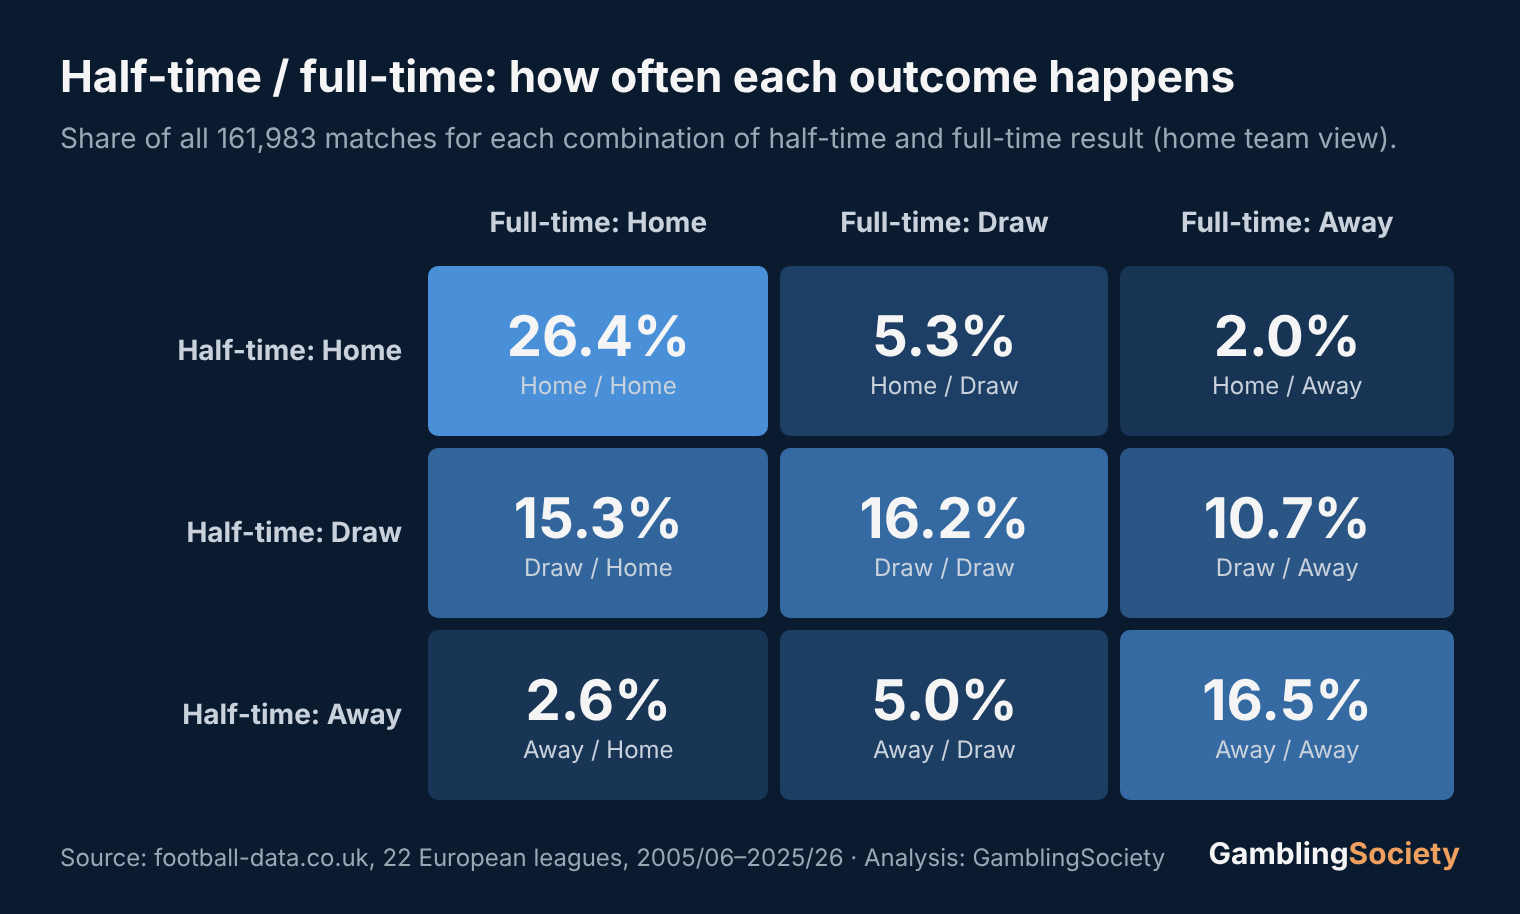
The middle row matters most. 42.2% of all matches were level at half-time, and those matches split three ways: home win (15.3% of all matches), draw (16.2%) or away win (10.7%).
How often a half-time lead holds
| Half-time lead | Matches | Leader wins | Draw | Leader loses |
|---|---|---|---|---|
| 1 goal | 68,980 | 67.9% | 22.0% | 10.1% |
| 2 goals | 19,618 | 90.2% | 7.2% | 2.6% |
| 3 goals or more | 4,950 | 98.1% | 1.6% | 0.2% |
| Any half-time lead | 93,549 | 74.2% | 17.8% | 8.0% |
A one-goal half-time lead is the big unknown. The leader won about two out of three of those matches (67.9%), drew 22.0% and lost one in ten. A second goal changes almost everything: with a two-goal half-time lead the leader won 90.2% and lost only 2.6%.
Home advantage shows here too. A home team leading at half-time won 78.3% of the time, an away team in the same position only 68.4%. Away leaders were caught for a draw in 20.9% of cases. Our article on home advantage shows how that edge has changed over the years.
Comebacks: who turns it around
| Behind at half-time | Matches | Comeback win | Draw | Lost |
|---|---|---|---|---|
| Home team, 1 goal behind | 29,880 | 13.0% | 24.8% | 62.2% |
| Away team, 1 goal behind | 39,100 | 7.8% | 19.8% | 72.3% |
| Home team, 2 goals behind | 7,527 | 3.7% | 9.4% | 87.0% |
| Away team, 2 goals behind | 12,091 | 1.9% | 5.9% | 92.2% |
A home team a goal down at half-time still won 13.0% and drew 24.8%, so it took something from the game in more than a third of cases. An away team in the same spot won 7.8%. Two goals behind, comebacks became rare: 3.7% for home teams, 1.9% for away teams.
The more interesting question for live bettors: does it matter who is behind? It does, a lot. The next chart splits all teams a goal down at half-time by their win chance before kickoff.
Strong favourites (70% or more before kickoff) who were a goal down at half-time still won 39.9% of those matches and drew 29.4%. Only 31% lost. For clear underdogs (below 25%) a comeback win happened in just 4.2% of cases. A half-time score matters, but the quality gap between the teams does not disappear at the break.
0-0 at half-time
31.0% of all matches were 0-0 at half-time, the most common half-time score by far. From there, 35.9% ended as home wins, 38.8% as draws and 25.3% as away wins. One in four (25.2%) stayed goalless until the end.
For goal bettors this is useful: after a 0-0 half-time, only 16.4% of matches reached three goals, because that needs three goals in 45 minutes plus stoppage time. On average these matches produced 1.39 second-half goals. Our analysis of over 2.5 goals by league shows how the pre-match market prices goals.
More goals after the break
Second halves are livelier. On average 1.16 goals fell before the break and 1.48 after it, so 56.0% of all goals were scored in the second half. Tired legs, substitutions and teams chasing a result all play a part, and the second half usually has more stoppage time.
Half-time leads have become slightly less safe. In the first three seasons of our data the leader won 74.9% of matches, in the last three 72.9%. The change is small, and it came at the same time as more goals per match and longer stoppage times. Our data cannot say which of the two mattered more.
Half-time leads by league
| League ↕ | Matches ↕ | Half-time lead holds ↕ | 1 goal behind: point or more ↕ | Goals after the break ↕ | Draws ↕ | Draw bets, best price ↕ |
|---|---|---|---|---|---|---|
| Greek Super League | 5,130 | 78.8% | 26.6% | 55.7% | 26.0% | −5.4% |
| Scottish Premiership | 4,739 | 76.4% | 30.2% | 55.7% | 24.1% | −5.0% |
| Scottish League Two | 3,667 | 76.4% | 31.0% | 54.9% | 22.2% | −13.4% |
| Premier League | 7,980 | 76.3% | 30.8% | 55.6% | 24.3% | −2.9% |
| Primeira Liga | 5,866 | 76.0% | 29.8% | 55.5% | 25.2% | −6.1% |
| Scottish League One | 3,669 | 75.8% | 30.5% | 55.8% | 22.4% | −11.7% |
| La Liga | 7,980 | 75.6% | 31.0% | 55.9% | 24.9% | −4.2% |
| Belgium Pro League | 5,673 | 75.5% | 30.8% | 56.9% | 24.9% | −3.1% |
| Eredivisie | 6,320 | 75.3% | 32.4% | 56.8% | 23.3% | −0.4% |
| Bundesliga | 6,425 | 75.2% | 32.0% | 55.7% | 25.1% | +1.6% |
| Scottish Championship | 3,692 | 74.8% | 32.5% | 55.6% | 27.3% | +3.1% |
| Ligue 1 | 7,656 | 73.9% | 32.1% | 56.1% | 27.3% | −1.2% |
| National League (ENG 5) | 11,234 | 73.8% | 32.5% | 55.5% | 25.5% | −5.5% |
| Süper Lig | 6,672 | 73.6% | 32.8% | 56.5% | 25.8% | −2.1% |
| La Liga 2 | 9,665 | 73.5% | 31.2% | 57.0% | 29.4% | −2.4% |
| League One (ENG 3) | 11,440 | 73.4% | 32.8% | 55.6% | 26.2% | −4.8% |
| Serie A | 7,978 | 73.3% | 33.1% | 56.2% | 26.4% | −0.5% |
| League Two (ENG 4) | 11,480 | 73.2% | 32.8% | 55.9% | 27.2% | −3.1% |
| Championship (ENG 2) | 11,591 | 73.2% | 32.8% | 56.2% | 27.3% | −1.9% |
| 2. Bundesliga | 6,426 | 72.3% | 34.6% | 56.7% | 27.3% | +0.6% |
| Ligue 2 | 7,694 | 72.2% | 33.3% | 56.1% | 30.2% | −1.1% |
| Serie B | 9,006 | 71.0% | 34.2% | 54.9% | 31.8% | +3.6% |
The differences between leagues are moderate. Half-time leads held most often in the Greek Super League (78.8%) and least often in Serie B (71.0%). Leagues with many draws also have more matches where a half-time lead turns into a draw.
Draws: priced almost exactly
Over the whole period, 26.5% of matches ended in a draw, and the odds implied 26.7%. That is almost exact. Backing every draw lost 8.6% per bet at average odds, 2.7% at the best price and 3.4% at Pinnacle’s closing odds.
| Gap between the teams (pre-match win chances) | Matches | Draws | Implied by odds | Return, average odds | Return, best price |
|---|---|---|---|---|---|
| Under 10 points (even game) | 42,839 | 29.5% | 29.1% | −5.8% | −0.6% |
| 10 to 20 points | 37,769 | 29.1% | 28.7% | −6.0% | −0.8% |
| 20 to 35 points | 40,746 | 27.2% | 27.3% | −7.7% | −2.1% |
| 35 to 50 points | 23,048 | 23.4% | 24.6% | −11.5% | −4.9% |
| 50 points or more (big favourite) | 17,449 | 15.8% | 18.1% | −19.1% | −10.3% |
The pattern is the same favourite-longshot bias we found for favourites and for over/under bets. In even games the draw came in 29.5% of the time against 29.1% implied, and draw bets lost only 0.6% at the best price. In games with a big favourite the draw was overpriced: 15.8% real against 18.1% implied, a loss of 19.1% per bet.
By league, draws were most common in Serie B (31.8%), Ligue 2 (30.2%) and La Liga 2 (29.4%), all second divisions. They were rarest in Scottish League Two (22.2%) and Scottish League One (22.4%), where backing every draw lost 19.9% and 18.4% per bet at average odds. The full list is in the league table above.
Which draws happen? Almost half are 1-1 (46.7%), followed by 0-0 (29.5%) and 2-2 (19.7%). Matches level at half-time ended as draws 38.3% of the time.
Serie B: the one stand-out
Serie B is the draw league in our data: 31.8% of its matches ended level, more than in any other league, while the odds implied 29.9%. Since 2016/17 the gap has been large enough to matter. Backing every Serie B draw returned +3.6% per bet at average odds, +9.3% at the best price and +6.5% at Pinnacle’s closing odds, over 3,916 matches. It was profitable at average odds in 8 of those 10 seasons.
Before you rush to back every draw in Italy’s second division, three warnings. First, we looked at 22 leagues, and with that many, one can look good by chance. Second, the result at Pinnacle’s close is about 2.6 standard errors from zero, interesting but not proof. Third, Serie B is a small market with low betting limits, and it was not profitable from 2005/06 to 2015/16. Treat it as a pattern worth watching. If you want to test it, start small and record every bet.
What this means for your bets
- A one-goal half-time lead is not a banker. One in three of those matches did not end in a win for the leader. Live odds on the leader should reflect that.
- Two goals is a different world. Leaders with a two-goal half-time lead lost only about one match in forty.
- Look at who is behind. A strong favourite a goal down at half-time still took points in about seven out of ten matches.
- 0-0 at the break means few goals. Only about one in six of those matches reached three goals.
- Draws are priced well. Even games are the closest to fair. Draws against big favourites lose the most.
- Track your live bets. Live markets carry higher margins than pre-match markets. Our free Bet Tracker shows if your live bets really pay.
What this analysis does not show
- There are no live or half-time/full-time odds in the data. We can show how often outcomes happen, but not whether the live price you get is good value.
- Red cards, injuries and substitutions are not taken into account. A comeback against ten men is counted like any other.
- Half-time scores show the state of the game, not how it was played. A team a goal down may have dominated the first half.
- The Serie B draw result comes from one of 22 leagues and from a period we can see only in hindsight.
FAQ: half-time leads and draws
How often does the team leading at half-time win?
In 161,983 matches from 22 European leagues, the half-time leader won 74.2%, drew 17.8% and lost 8.0%. With a one-goal half-time lead it was 67.9%, with two goals 90.2%.
How often do teams come back from a goal down at half-time?
Home teams a goal down at half-time won 13.0% and drew 24.8%. Away teams won 7.8% and drew 19.8%. Strong favourites came back to win 39.9% of the time.
What is the most common half-time/full-time result?
Home lead at half-time and home win at full-time (26.4% of matches), followed by draw/draw (16.2%) and away/away (16.5%).
Is betting on draws profitable?
Not in general. Backing every draw lost 8.6% per bet at average odds. The exception in our data is Serie B since 2016/17, which returned +3.6% at average odds, with the caveats explained above.
Where does the data come from?
From football-data.co.uk, which publishes free historical results, half-time scores and bookmaker odds. We used 161,983 matches from 22 European leagues, 2005/06 to 2025/26. All numbers were calculated by us from that data.
Related guides
- Lucky Winners and Unlucky Losers: what shots on target say about the next match.
- Over 2.5 Goals by League: goals and over/under odds in 22 leagues.
- Is Home Advantage Disappearing?: home advantage before, during and after COVID.
- Are Favourites Overpriced?: the favourite-longshot bias in the 1X2 market.