
Over 2.5 goals is one of the most popular bets in football. You need three goals or more, and every match has a price for it. But which leagues go over most often, has football become more open, and do the bookmakers price the over 2.5 goals market correctly? We checked 161,821 matches from 22 European leagues since 2005/06, each with the market odds for over and under 2.5 goals.
The short answer: 49.1% of all matches went over 2.5 goals, the rate has risen clearly since the mid-2000s, and the odds tracked every league so closely that backing over or under blindly lost money everywhere. The only patterns that came close to a profit needed the best price on the market.
Key findings
- Across 161,821 matches, 49.1% went over 2.5 goals. The odds implied 49.3%, almost exactly the same.
- Goals are up: in 2005/06, 45.4% of matches went over 2.5 goals. The record was 2023/24 with 53.3%, and 2025/26 ended at 52.2%.
- The league gap is huge: from 42.3% in La Liga 2 to 58.7% in the Eredivisie. But in 21 of 22 leagues the odds were within 1.5 percentage points of the real rate.
- Backing every over lost 6.8% per bet at average odds, every under 6.3%. At the best available price the loss shrank to about 2%.
- Overs in May and unders in February and March were the only stretches that showed a small profit, and only at the best price. We explain below why that is weaker than it looks.
Contents
Over 2.5 goals: the data and the method
We used the free historical results and odds from football-data.co.uk for 22 European leagues from 2005/06 to 2025/26: every finished match with over/under 2.5 goals odds, 161,821 in total. The current season 2026/27 is not included.
- Over 2.5 goals means three or more goals in the 90 minutes plus stoppage time. Extra time and penalties do not count.
- Average odds are the average of all bookmakers football-data.co.uk lists for a match. Best price is the highest of those prices, so it is the most you could have got if you had an account with every one of them.
- Implied rate is the probability the odds give for over 2.5 goals once the bookmaker margin is removed. If the odds say 49% and 49% of matches go over, the market priced that group correctly.
- Return is the average profit or loss per bet with the same stake on every match. −6% means you lose six cents for every dollar you bet.
- Pinnacle opening and closing odds for over/under are available from 2019/20 until January 2026. We use them for the section on moving odds.
How often do matches go over 2.5 goals?
Slightly less than half the time. 49.1% of all 161,821 matches ended with three goals or more, at an average of 2.64 goals per match. That is why the line sits at 2.5: it splits matches almost exactly in two, so both sides can be offered at similar odds. The typical price was 1.94 for the over and 1.82 for the under.
| Goals in the match | 0 | 1 | 2 | 3 | 4 | 5 | 6 or more |
|---|---|---|---|---|---|---|---|
| Share of matches | 7.8% | 18.3% | 24.8% | 21.7% | 14.4% | 7.7% | 5.4% |
Two goals is the most common total (24.8%), closely followed by three (21.7%). This is what makes the bet so tight: a single goal in either direction decides it in almost half of all matches. Only 7.8% of matches ended 0-0.
Over 2.5 goals by season: more goals than 20 years ago
Football has become more open. In 2005/06, 45.4% of matches went over 2.5 goals, at 2.50 goals per match. The share passed 50% for the first time in 2011/12, reached a record of 53.3% in 2023/24 (2.79 goals per match), and stood at 52.2% in 2025/26. The season without fans, 2020/21, was a dip (47.9%), which fits our finding that home teams scored less without a crowd.
The rise is broad: 20 of 22 leagues had a higher over 2.5 goals rate in the last three seasons than in the first three. The biggest jumps came in leagues that used to be known for few goals:
| League | Over 2.5 goals 2005/06–2007/08 | Over 2.5 goals 2023/24–2025/26 | Change |
|---|---|---|---|
| Ligue 1 | 39.5% | 53.7% | +14.2 points |
| Premier League | 45.6% | 58.8% | +13.2 points |
| Primeira Liga | 39.5% | 52.7% | +13.2 points |
| Greek Super League | 39.9% | 52.0% | +12.2 points |
| Bundesliga | 52.2% | 62.0% | +9.8 points |
| La Liga | 45.4% | 48.2% | +2.9 points |
| Serie A | 47.1% | 47.7% | +0.7 points |
Ligue 1 went from the lowest-scoring top league to an average one. The Premier League rose from 45.6% to 58.8%, and in 2023/24 it reached 64.7% of its matches went over 2.5 goals. Serie A and La Liga changed much less.
The bookmakers moved with the trend. The grey line in the chart follows the blue one closely: the implied rate rose from 48.0% to 51.1%. In the early seasons the odds were a little too keen on overs; in the record season 2023/24 they lagged slightly behind (51.9% implied). In no season was the gap big enough to make blind over or under bets profitable at average odds.
Over 2.5 goals by league
The league is the biggest single factor. In the Eredivisie, 58.7% of all matches went over 2.5 goals, followed by the Bundesliga (57.2%) and Scottish League One (56.6%). At the other end are La Liga 2 (42.3%), the Greek Super League (42.5%) and Ligue 2 (42.6%). That is a gap of more than 16 percentage points between a typical Dutch and a typical Spanish second-division match.
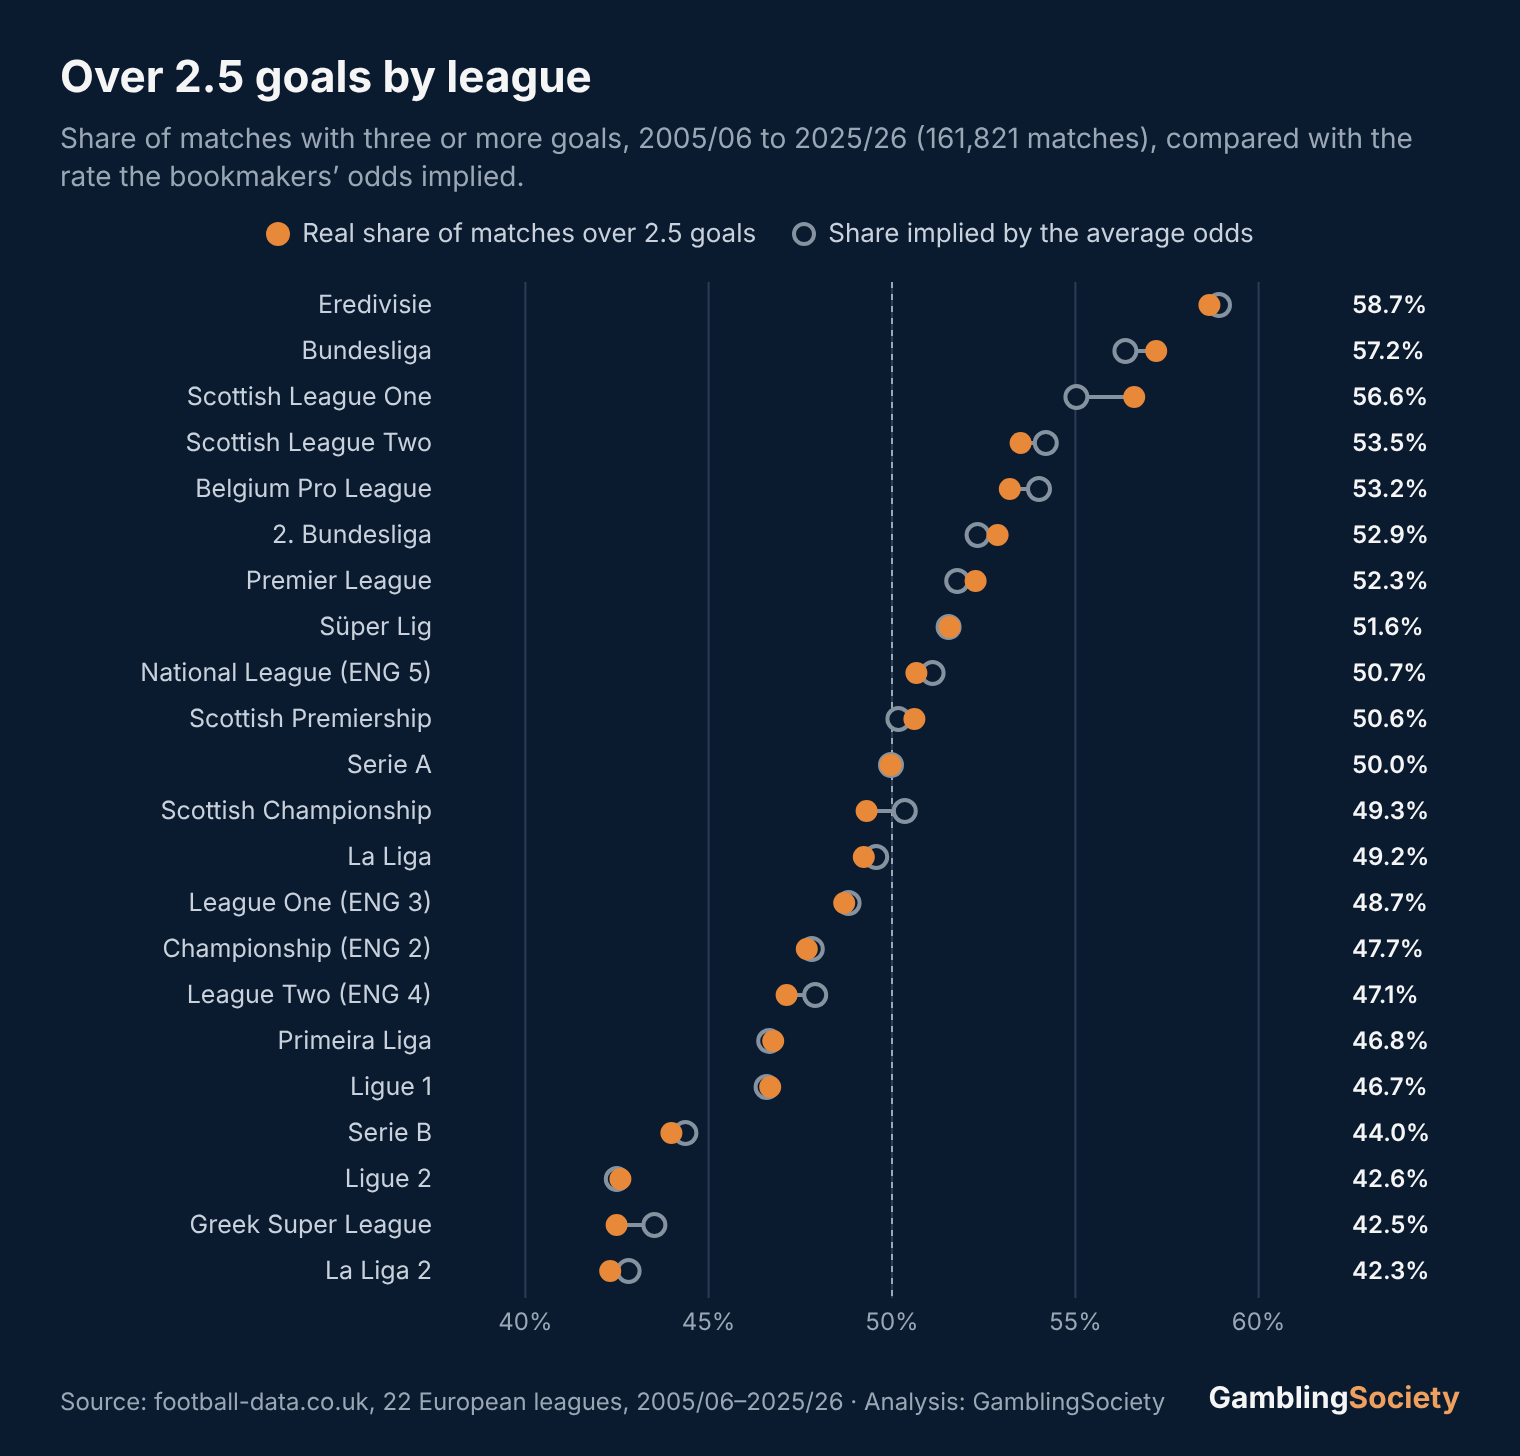
But the odds knew it. In 21 of 22 leagues, the implied rate was within 1.5 points of the real one. The biggest gap was in Scottish League One, where 56.6% went over against 55.0% implied. Even there, backing every over lost 3.7% per bet at average odds and 0.3% at the best price. The Bundesliga, the classic tip for over bets, lost 4.6% per over bet at average odds.
| League ↕ | Matches ↕ | Goals per match ↕ | Over 2.5 goals ↕ | Implied by odds ↕ | Backing over: average / best price ↕ | Backing under: average / best price ↕ |
|---|---|---|---|---|---|---|
| Eredivisie | 6,320 | 3.08 | 58.7% | 58.9% | −7.1% / −3.3% | −6.3% / −0.6% |
| Bundesliga | 6,426 | 2.98 | 57.2% | 56.4% | −4.6% / −0.6% | −8.2% / −3.2% |
| Scottish League One | 3,664 | 2.96 | 56.6% | 55.0% | −3.7% / −0.3% | −9.6% / −5.2% |
| Scottish League Two | 3,661 | 2.85 | 53.5% | 54.2% | −7.9% / −4.4% | −5.3% / −0.8% |
| Belgium Pro League | 5,679 | 2.80 | 53.2% | 54.0% | −8.0% / −3.8% | −5.0% / −0.1% |
| 2. Bundesliga | 6,422 | 2.77 | 52.9% | 52.3% | −5.4% / −0.9% | −7.5% / −2.7% |
| Premier League | 7,980 | 2.74 | 52.3% | 51.8% | −4.8% / −0.4% | −6.6% / −2.1% |
| Süper Lig | 6,676 | 2.72 | 51.6% | 51.5% | −6.5% / −2.0% | −6.8% / −2.4% |
| National League (ENG 5) | 11,169 | 2.71 | 50.7% | 51.1% | −7.5% / −3.3% | −5.8% / −1.5% |
| Scottish Premiership | 4,734 | 2.66 | 50.6% | 50.2% | −5.6% / −0.8% | −7.1% / −2.5% |
| Serie A | 7,976 | 2.67 | 50.0% | 50.0% | −5.9% / −1.4% | −5.9% / −1.4% |
| Scottish Championship | 3,691 | 2.67 | 49.3% | 50.3% | −8.6% / −4.4% | −4.7% / −0.4% |
| La Liga | 7,979 | 2.67 | 49.2% | 49.6% | −6.8% / −2.3% | −5.7% / −1.2% |
| League One (ENG 3) | 11,438 | 2.61 | 48.7% | 48.8% | −6.5% / −2.0% | −6.1% / −1.8% |
| Championship (ENG 2) | 11,591 | 2.56 | 47.7% | 47.8% | −6.3% / −1.6% | −5.7% / −1.5% |
| League Two (ENG 4) | 11,474 | 2.55 | 47.1% | 47.9% | −7.9% / −3.4% | −4.9% / −0.6% |
| Primeira Liga | 5,860 | 2.53 | 46.8% | 46.7% | −6.5% / −1.5% | −6.8% / −2.7% |
| Ligue 1 | 7,657 | 2.54 | 46.7% | 46.6% | −6.3% / −1.3% | −6.8% / −2.5% |
| Serie B | 8,971 | 2.43 | 44.0% | 44.4% | −7.6% / −2.5% | −6.1% / −2.1% |
| Ligue 2 | 7,689 | 2.37 | 42.6% | 42.5% | −6.7% / −1.2% | −7.1% / −3.2% |
| Greek Super League | 5,112 | 2.35 | 42.5% | 43.5% | −9.7% / −4.6% | −5.7% / −1.6% |
| La Liga 2 | 9,652 | 2.38 | 42.3% | 42.8% | −8.2% / −3.1% | −6.0% / −2.3% |
Not one league returned a profit on overs or unders over the whole period, at average odds or at the best price. Knowing that the Eredivisie scores a lot is useful, but it is the same knowledge the bookmakers price in. The high-scoring leagues simply have shorter odds for over 2.5 goals: a typical Eredivisie over paid 1.60, a typical La Liga 2 over 2.20.
Do the odds get over 2.5 goals right?
Overall, very nearly. The odds implied 49.3% overs and the real rate was 49.1%. If we group all matches by how likely the odds made over 2.5 goals look, the real rate stays close to the prediction in every group. But the small gaps that remain all point the same way, and they decide how much you lose.
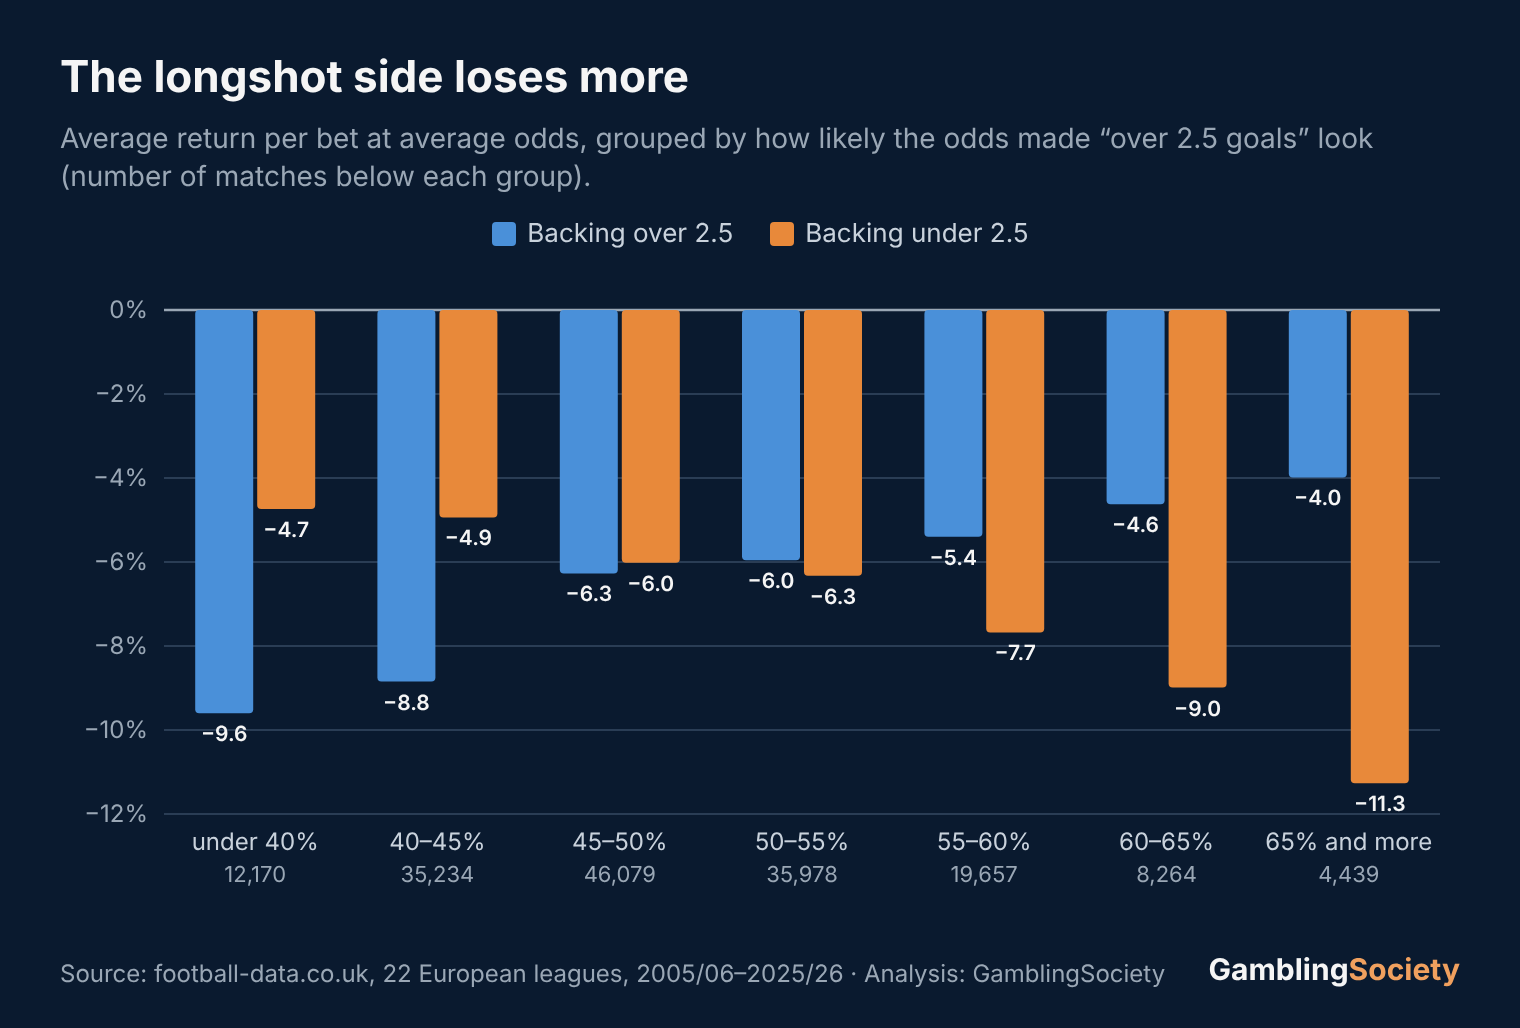
When the odds made over 2.5 goals unlikely (below 40%, typically a defensive match in a low-scoring league), only 36.5% went over against 37.7% implied, and backing the over lost 9.6% per bet. When an over looked very likely (65% or more), it came in 71.1% of the time against 69.5% implied. Backing the under in those matches lost 11.3%.
This is the same favourite-longshot bias we found in the 1X2 market in our analysis Are Favourites Overpriced?: the less likely side is priced a little too short. Over all matches, backing the side the odds favoured lost 5.5% per bet, backing the other side 7.5%. Neither is a winning strategy, but one loses about a third less.
What the bookmaker keeps on over/under bets
Every over/under price has the bookmaker’s cut built in. In 2005/06, the average margin on over/under 2.5 goals was 8.6%. By 2020/21 it had fallen to 5.8%, and it was 6.1% in 2024/25. Over/under has been cheaper than the 1X2 market in every single season.
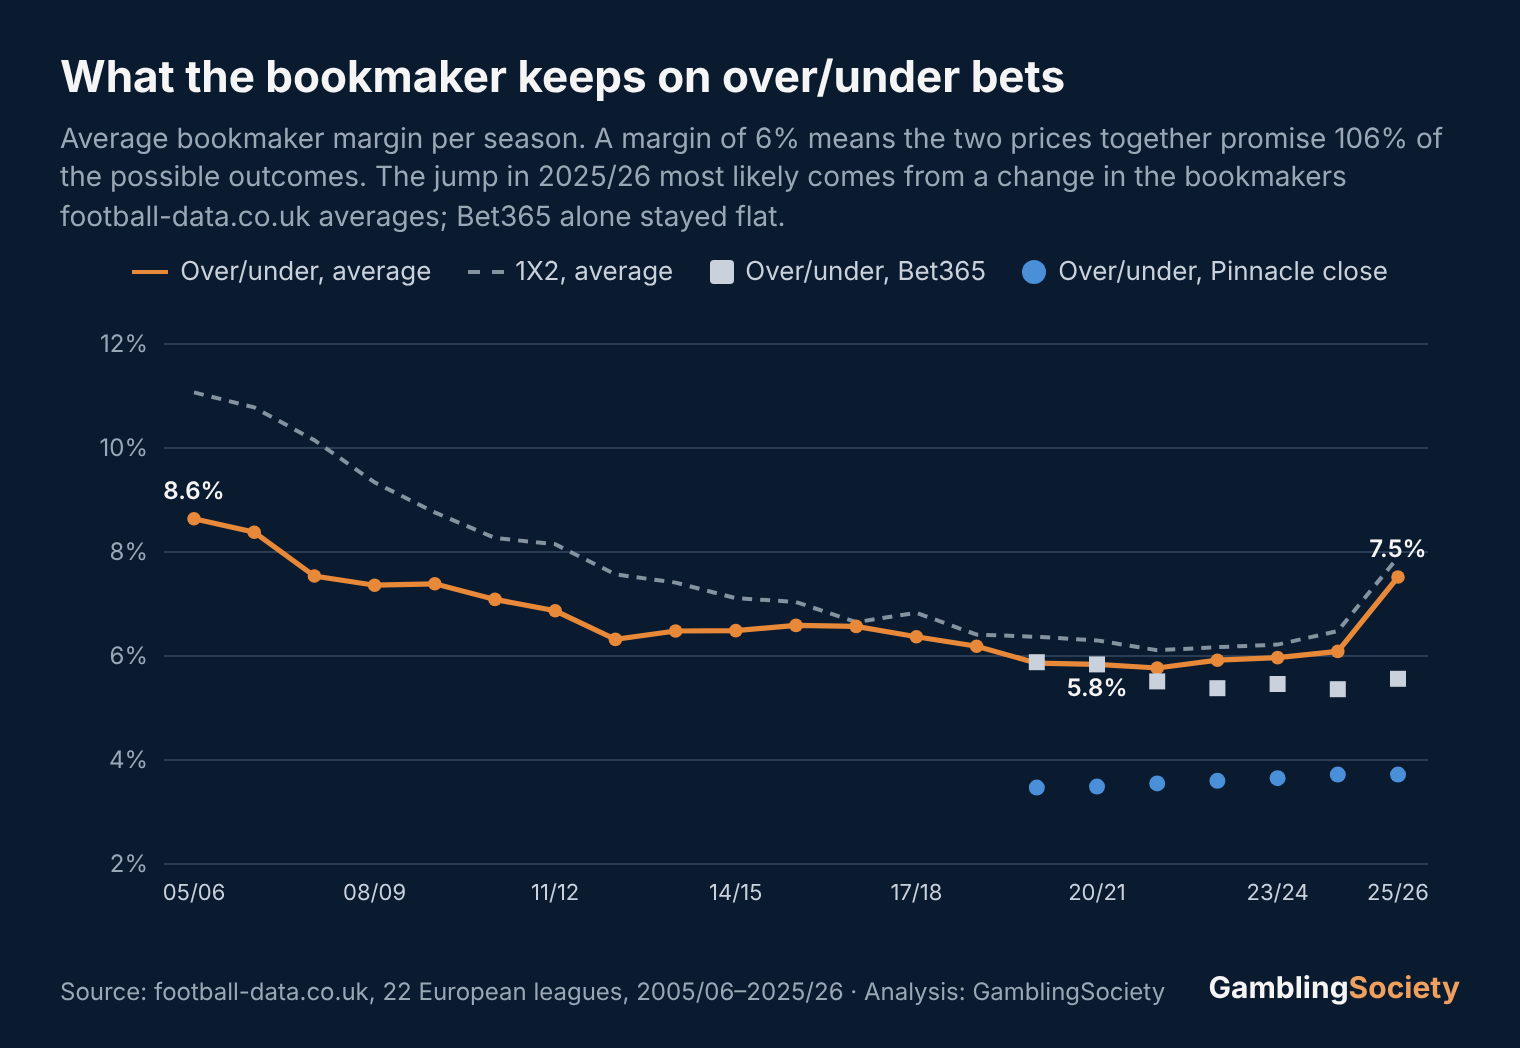
For 2025/26 the average jumps to 7.5%. That is not a real price rise. Bet365’s own over/under margin stayed between 5.4% and 5.9% in every season since 2019/20, including 2025/26. The jump most likely comes from a change in which bookmakers football-data.co.uk includes in its average; Pinnacle, for example, is missing from the data after January 2026.
The margin is the main reason blind bets lose. At average odds every over/under bet lost about 6.5%. At the best price, which on average carried a margin of only 2.0%, the loss fell to 2.2% for overs and 1.9% for unders. Pinnacle’s closing odds, with a margin of about 3.6%, sit in between. Comparing prices does more for your results than any league tip in this article. Our guide to how sportsbooks set odds explains where the margin comes from.
What moving odds tell you
For 48,298 matches from 2019/20 to January 2026 we have Pinnacle’s opening and closing odds for over/under 2.5 goals. Pinnacle is the sharpest large bookmaker, so its price moves show where the informed money went.
| How the over price moved before kickoff | Share of matches | Over 2.5 goals: real | Over 2.5 goals: implied at opening | Over at opening odds | Under at opening odds |
|---|---|---|---|---|---|
| Over shortened by more than 8% | 5.7% | 56.4% | 49.1% | +10.9% | −18.0% |
| Over shortened by 3% to 8% | 17.0% | 55.2% | 51.3% | +3.3% | −12.2% |
| Little change | 45.1% | 50.9% | 50.7% | −3.5% | −4.5% |
| Under shortened by 3% to 8% | 20.8% | 46.4% | 49.1% | −9.1% | +1.2% |
| Under shortened by more than 8% | 11.4% | 42.7% | 47.7% | −13.9% | +5.9% |
The moves were right far more often than not. When the over price shortened by more than 8%, 56.4% of those matches went over 2.5 goals, although the opening odds had implied only 49.1%. Backing the over at the opening price would have returned +10.9% per bet. At the closing price the same bets lost 0.8%.
The catch: you only know which way the odds moved after the move has happened. Those returns belong to the people who moved the line. What you can do is check your own bets against the closing price: if you regularly get better odds than the close, you are probably doing something right. Our articles on shortening odds and closing line value show the same effect in the 1X2 market.
End of season: the closest thing to an edge
One pattern stood out. In May, 54.9% of matches went over 2.5 goals, while the odds implied 52.5%. At the best price, backing every over in May returned +2.1% per bet over 9,786 matches. It was positive in 14 of 21 seasons and in 17 of 22 leagues. Winter shows the mirror image: unders in February (+1.1%) and March (+0.8%) also came out slightly ahead at the best price.
A likely reason for May is that many matches at the end of a season matter to only one team, or to nobody, and open games follow. Heavy winter pitches may explain part of the February and March effect. Our data cannot prove either explanation.
Before you build a strategy on it, look at the other numbers. At average odds, May overs still lost 2.3% per bet. At Pinnacle’s closing odds, the best measure of a fair price, they lost about 0.5% (compared with about 3% for all overs). Only the maximum price shows a profit, and nobody gets the best of all listed bookmakers on every bet, especially not on winning bets. We also looked at 12 months, two sides and two prices: with that many slices, finding one that looks good by chance is normal.
Our verdict: end-of-season overs are the least bad over/under bet in the data, and the bookmakers seem to price them a little cautiously. It is not an edge you can collect without the very best prices, so treat it as a tie-breaker, not a system.
What this means for your over 2.5 bets
- Shop for the price. The difference between average odds and the best price (about 4.5 points per bet) is bigger than any league or timing effect we found. A second or third bookmaker account pays for itself.
- Use league rates as a starting point. An over 2.5 goals bet in the Eredivisie is not better value than one in Serie B. It is only more likely to win, and the odds already reflect that.
- Be careful with longshot totals. Overs in tight, low-scoring matches and unders in matches with very short over odds lost the most.
- Compare with the closing odds. Moving lines are the clearest signal in this data. If your bets regularly beat the close, keep going; if they don’t, a good run is probably luck.
- Track every bet. Over/under bets win often enough to feel profitable. Our free Bet Tracker shows your real return, and the odds converter turns any price into an implied probability.
What this analysis does not show
- It looks at matches in groups, not at single matches. A good model of team strength, injuries or expected goals could still find value in individual games; this analysis does not test that.
- It covers the 2.5 line in 22 European leagues only, not 1.5 or 3.5 goals, Asian totals, live betting or other sports.
- “Best price” is the top price across all listed bookmakers. In real life you rarely get it on every bet, and some bookmakers limit winning customers.
- The current season 2026/27 is not part of the analysis. In its first weeks (until 20 September, 1,285 matches) 56.0% went over 2.5 goals, but early-season numbers swing a lot.
Over 2.5 goals FAQ
What percentage of football matches go over 2.5 goals?
In 22 European leagues from 2005/06 to 2025/26, 49.1% of 161,821 matches went over 2.5 goals. In recent seasons the rate has been slightly above 50%: 52.0% from 2023/24 to 2025/26.
Which league has the most over 2.5 goals?
The Eredivisie, with 58.7% of matches over 2.5 goals since 2005/06, followed by the Bundesliga (57.2%) and Scottish League One (56.6%). The fewest were in La Liga 2 (42.3%), the Greek Super League (42.5%) and Ligue 2 (42.6%).
Is betting on over 2.5 goals profitable?
Not blindly. Backing every over 2.5 goals bet lost 6.8% per bet at average odds and 2.2% at the best price. No league was profitable over the whole period. Overs in May came out slightly ahead only at the best available price.
Why is the line at 2.5 goals?
Because it splits matches almost in half. With an average of 2.64 goals per match, 49.1% of games have three or more goals, so bookmakers can offer both sides at similar odds.
Are over/under odds more accurate than 1X2 odds?
They are cheaper. The average margin on over/under 2.5 goals was 6.7% over the whole period, compared with 7.7% on 1X2. Both markets show the same small favourite-longshot bias.
Where does the data come from?
From football-data.co.uk, which publishes free historical results and bookmaker odds. We used 161,821 matches from 22 European leagues, 2005/06 to 2025/26. All numbers were calculated by us from that data.
Related guides
- Are Favourites Overpriced?: the favourite-longshot bias in the 1X2 market.
- Is Home Advantage Disappearing?: home advantage before, during and after COVID.
- Do Odds That Shorten Before Kickoff Win More Often?: what line moves are really worth.
- Closing Line Value: how to tell if your bets beat the market.
- Expected Value and Value Betting: when a bet is worth placing.
- Are Promoted Teams Overrated?: our analysis of promoted teams in 11 leagues.