
Every bettor knows the feeling: your team dominates, hits the woodwork twice, the keeper has the game of his life, and the match ends 0-1. A week later the odds treat them as a losing side. Does the betting market look past the score? We compared the result of 111,494 matches with the shots on target of both teams, and then followed every team into its next match.
The short answer: the market trusts the score a little too much. Teams that won despite clearly fewer shots on target lost 12.2% per bet in their next match, against 8.2% for all teams. Teams that lost despite clearly more shots on target lost only 2.8%. The first effect has held for 20 years. The second has largely disappeared in the last ten.
Key findings
- The team with more shots on target won 57.4% of matches. With a difference of three or more, it still lost 11.5% of the time.
- Lucky winners (won with 3+ fewer shots on target) lost 12.2% per bet in the next match. Ordinary teams at the same odds lost 8.1%.
- Unlucky losers (lost with 3+ more shots on target) lost only 2.8%, against 8.3% for comparable teams. At the best price they even made +4.4%.
- The lucky-winner effect was similar in both decades (−12.6% and −11.7%). The unlucky-loser effect fell from +0.6% to −6.4%.
- A team’s season-long shot record is priced correctly. The market only slips on the most recent result.
Contents
The data and the method
We used the free historical results, match statistics and odds from football-data.co.uk. Shots on target are available for the English leagues, the five big leagues and the Scottish Premiership since 2005/06, and for the other leagues since 2017/18. In total 111,494 matches qualify.
- Lucky winner: a team that won although it had at least three fewer shots on target than its opponent.
- Unlucky loser: a team that lost although it had at least three more shots on target.
- Deserved winner / loser: the same margin, but the result went the way the shots suggested.
- We fixed the margin of three shots before looking at any betting returns. The section on the margin shows what happens with other values.
- Next match means the team’s next league match in the same season. We calculated the return of a one-unit bet on that team at the average odds, the best available price and, from 2012/13, Pinnacle’s closing odds.
How often the side with more shots on target loses
First, how much do shots on target say about the result? A lot, but far from everything. Across all matches with a difference, the side with more shots on target won 57.4%, drew 25.5% and lost 17.2%. On average it took 3.4 shots on target to score one goal.
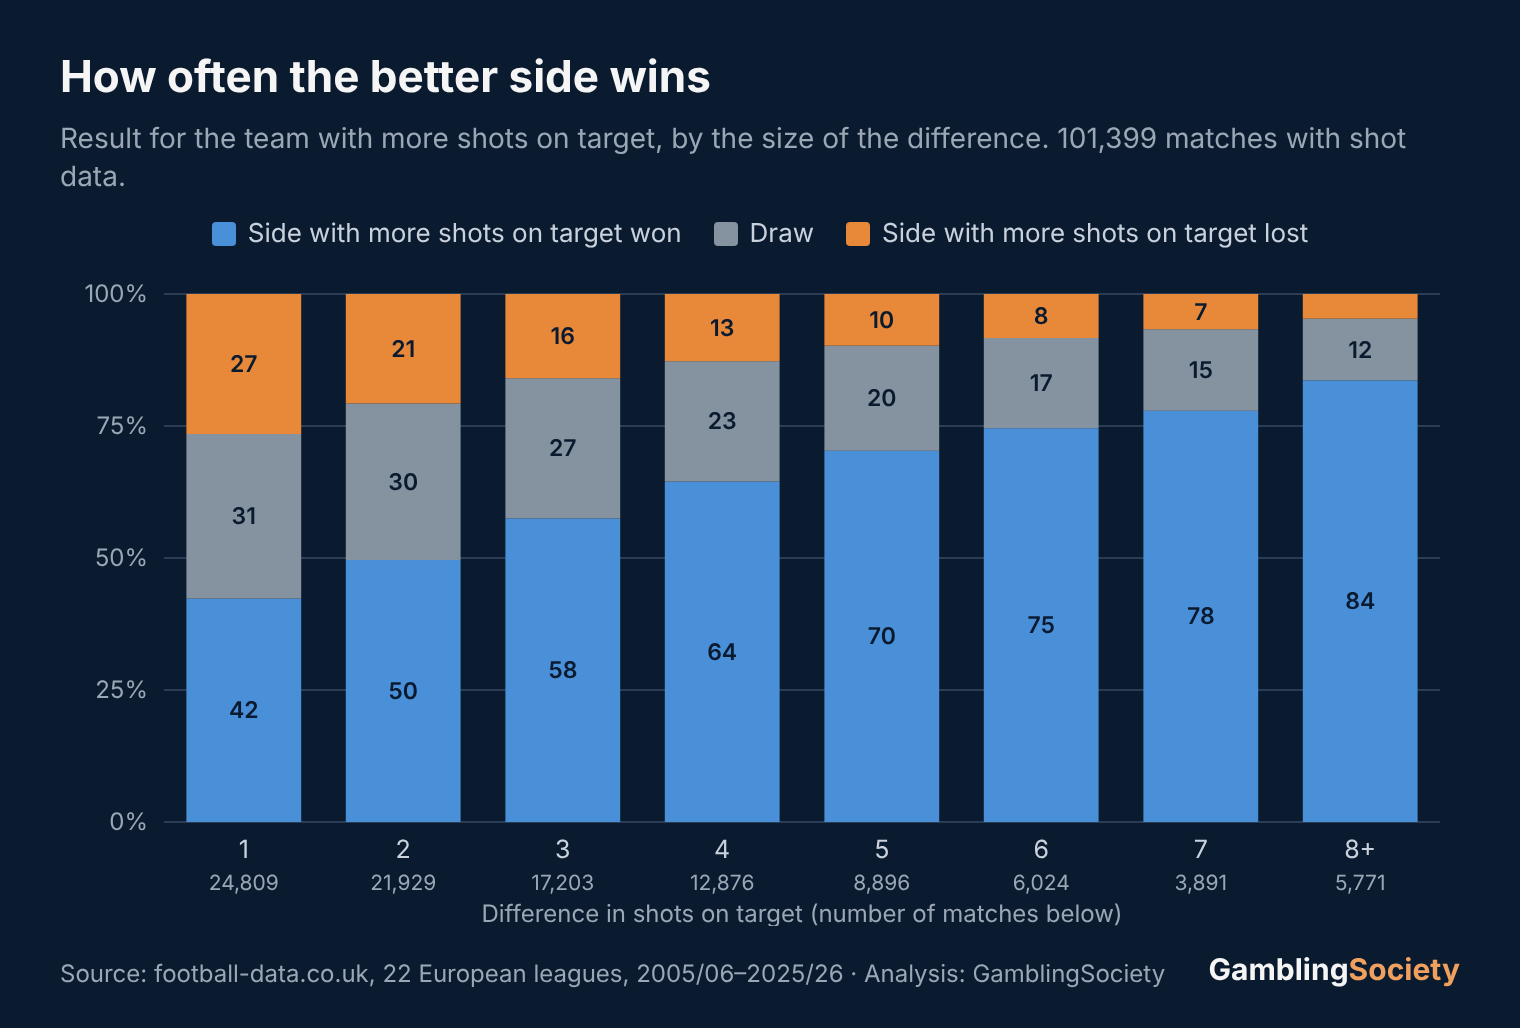
With one more shot on target the better side won only 42% of the time. With three more it won 58% and lost 16%. Even with eight or more, 5% of those teams lost. By our definition, 5.5% of all matches produce a lucky winner and an unlucky loser, about one match in 18.
What happens in the next match
| Last match | Bets | Next match: average odds | Ordinary teams at the same odds | Best price | Pinnacle close |
|---|---|---|---|---|---|
| Unlucky loser | 6,132 | −2.8% | −8.3% | +4.4% | −0.7% |
| Deserved winner | 35,717 | −6.1% | −7.1% | −0.5% | −3.7% |
| All teams | 222,942 | −8.2% | −8.2% | −2.0% | −4.1% |
| Deserved loser | 35,714 | −10.2% | −8.9% | −3.8% | −5.6% |
| Lucky winner | 6,131 | −12.2% | −8.1% | −6.1% | −8.3% |
Compare the two kinds of winner. Both won their last match. If the win was deserved, backing them next time lost 6.1% per bet, close to what their odds predicted. If the win was lucky, it lost 12.2%. Among losers it is the other way round: deserved losers −10.2%, unlucky losers −2.8%.
The control column matters. Lucky winners and unlucky losers have almost exactly the same odds mix as all teams in their next match, so the gaps do not come from favourites and underdogs. The market priced these teams as if the last score told the whole story.
Lucky winners: the clearer signal
The lucky-winner effect is the more reliable of the two. Backing teams after a lucky win lost 12.6% per bet from 2005/06 to 2015/16 and 11.7% from 2016/17 to 2025/26. They did worse than all teams in 14 of 21 seasons, and at Pinnacle’s closing odds they still lost 8.3% against 4.1% for everyone.
The effect even reaches one match further: two games after a lucky win, backing the same team still lost 12.0% per bet. It made no difference whether the next match was at home (−11.3%) or away (−13.2%).
For a bettor, this is mainly a reason to stay away. A team that just won a match it did not control is not a team to back at a shortened price.
Unlucky losers: an edge that has faded
The unlucky-loser effect looked like real value at first sight. Over all 21 seasons, these teams lost only 2.8% per bet in their next match and made +4.4% at the best price. They beat the average in 16 of 21 seasons.
| Period | Unlucky losers: bets | Average odds | Best price | Pinnacle close | All teams: average odds |
|---|---|---|---|---|---|
| 2005/06–2015/16 | 3,184 | +0.6% | +9.4% | +8.7% | −8.1% |
| 2016/17–2025/26 | 2,948 | −6.4% | −1.1% | −4.0% | −8.2% |
Split by decade, the picture changes. In the first ten seasons, unlucky losers were a profitable bet: +0.6% at average odds and +9.4% at the best price. In the last ten seasons it was −6.4% and −1.1%, still better than average but no longer a profit.
A likely reason: shot data and expected goals (xG) are now shown everywhere, from TV graphics to free stats sites, and bookmakers use them too. A team that dominated and lost is no longer a secret. The lucky winner seems harder to correct, perhaps because many bettors still back the team that just won.
Does the margin of three shots matter?
| Margin in shots on target | Unlucky losers: bets | Unlucky losers: next match | Lucky winners: bets | Lucky winners: next match |
|---|---|---|---|---|
| 1 or more | 16,975 | −4.8% | 16,976 | −10.7% |
| 2 or more | 10,572 | −5.5% | 10,572 | −11.3% |
| 3 or more | 6,132 | −2.8% | 6,131 | −12.2% |
| 4 or more | 3,454 | −2.3% | 3,453 | −13.9% |
| 5 or more | 1,857 | −1.6% | 1,857 | −12.9% |
The pattern does not depend on our choice of three shots. With any margin from one to five, unlucky losers did better than average and lucky winners worse. Larger margins mean fewer cases, so the numbers get noisier, but the lucky winners stay between −10.7% and −13.9% throughout.
Season-long shot numbers are already in the odds
If single results fool the market, maybe it underrates good teams in general? We checked each team’s shot-on-target balance per game over the season so far (from the sixth match on) and the return on backing it in the next match.
| Season balance per game | Bets | Won / implied by odds | Return, average odds | Expected from the odds mix |
|---|---|---|---|---|
| fewer than −2 | 15,832 | 25.3% / 26.1% | −12.7% | −11.3% |
| −2.0 to −0.5 | 60,233 | 29.8% / 30.4% | −10.1% | −9.8% |
| −0.5 to +0.5 | 56,126 | 35.2% / 35.4% | −8.3% | −8.3% |
| +0.5 to +2.0 | 47,669 | 43.2% / 42.2% | −5.7% | −6.5% |
| more than +2 | 19,726 | 57.2% / 55.3% | −3.8% | −4.1% |
Teams with a strong shot record lost far less (−3.8%) than teams with a poor one (−12.7%). But almost all of that is the familiar favourite-longshot bias: good teams are usually favourites, and favourites lose less per bet. Once the odds are taken into account, the season-long shot record adds almost nothing. The market knows who the good teams are. It only overreacts to the last result.
What this means for your bets
- Look at the shots, not only the score. Before you back a team that just won, check whether the win was deserved.
- Avoid lucky winners. This was the most consistent finding, in both decades and at Pinnacle’s closing odds.
- Do not expect easy money from unlucky losers. The edge was real in the 2000s and early 2010s, but the market has largely caught up.
- Get the best price. The difference between average odds and the best price was bigger than most effects in this article.
- Keep a record. If you use match statistics in your betting, track your results and your closing line value, for example with our free Bet Tracker.
What this analysis does not show
- Shots on target are a rough measure. A tap-in and a 35-yard shot count the same. Expected goals (xG) would be better, but there is no free xG data for all these leagues and seasons.
- Red cards, penalties and game state are not taken into account. A team that went down to ten men early may have fewer shots for a reason.
- Only league matches are included. A cup game between two league matches is not visible in the data.
- We looked at several groups and margins. The main definitions were fixed in advance, but some of the differences between single seasons and leagues are random.
FAQ: shots on target and betting
Do shots on target predict the result?
Partly. The team with more shots on target won 57.4% of matches and lost 17.2%. With a difference of three or more, it won 67.3%.
Should you back a team after an unlucky defeat?
It used to pay. From 2005/06 to 2015/16, backing unlucky losers in the next match returned +0.6% per bet at average odds. Since 2016/17 it has been −6.4%: better than average, but a loss.
Are teams overrated after a lucky win?
Yes, slightly. After winning with three or more fewer shots on target, teams lost 12.2% per bet in the next match. Comparable teams at the same odds lost 8.1%.
Where does the data come from?
From football-data.co.uk, which publishes free historical results, match statistics and bookmaker odds. We used 111,494 matches from 22 European leagues, 2005/06 to 2025/26. All numbers were calculated by us from that data.
Related guides
- Are Promoted Teams Overrated?: another case where the market follows early results too long.
- Does team form beat the market?: our test of hot and cold streaks.
- Over 2.5 Goals by League: goals and over/under odds in 22 leagues.
- Closing Line Value: how to tell if your bets beat the market.
- How Safe Is a Half-Time Lead?: how often a half-time lead holds, and how the odds price draws.